What are markers? In simple terms, they are “patterns” that a computer/mobile can read using an app and react in some way depending on the prepared program. So you can show a rotating globe in place of a marker, or start a process, etc. Although modern AR apps are now based more on markerless technology, i.e. without markers, it will be important for my apps that people can move the markers around, so I probably won’t avoid them.
So far I’ve primarily used Hiro markers, but there are more – Kanji, ARTag, etc. The most common markers are already preloaded in libraries e.g. AR.js How exactly this “setting”/”learning” works I haven’t investigated yet, anyway, if you have a “classic” marker, you can load it like this:
<a-marker-camera preset='hiro'></a-marker-camera>
or I’ve seen that option as well:
let patternArray = ["letterA", "letterB", "letterC", "letterD", "letterF", "kanji", "hiro"]
which loads multiple markers at once, and then you define in the folder what each marker looks like:
let markerControls = new THREEx.ArMarkerControls(arToolkitContext, markerRoot, {
type : 'pattern', patternUrl : "data/" + patternArray[i] + ".patt", });
for which you logically need to insert the corresponding scripts at the top of the page:
However, so that it doesn’t look like markers are just for augmented reality, I’ll take the liberty of showing some interesting examples of how they can, in conjunction with GIS, be used in land use planning or GIS gamification.
Example 1 – Mestometer
Mestometer is a collective interactive game from Slovakia, created by Samuel Velebný and his team. It is an interesting combination of IT, architecture, gamification, participation and community planning.
Sample 2 – Colortizer
Colortizer is open source developed by Ira Winder from MIT (GitHub) and was developed primarily for the CityScope project. Like Mestometer, it is written in Processing, but its source code is completely open and available. Similar to the first demo, it converts the markers it reads using a webcam and adds some values/visualizations to them.
Sample 3 – Tangible Landscape
The fact that markers are not necessarily just QR code or Hiro type markers is shown by Tangible Landscape, where various forms of colored tiles or cubes are used as markers.
I haven’t actually shown any of my own creations or any progress in this post, but just the amount I had to read to understand how markers work and how many interesting links I discovered, I take as progress in itself.
As part of a project at EmotionalMaps, a web map needed to be made for a client. Normally Ondra would have done this in no time, but this time I decided to program such a web map myself as part of my attempts to learn how to “code”.
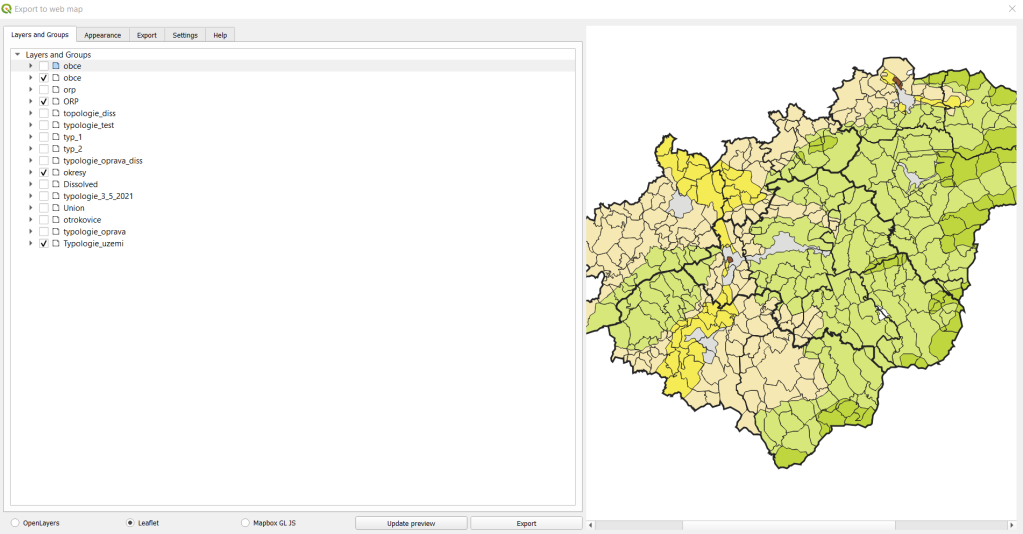
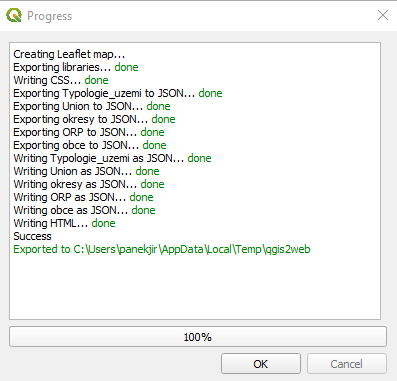
The first idea was to make the maps/layers in QGIS and then use the QGIS2Web plugin to “just export” the web viewer. Cool idea that looked simple, unfortunately I soon found out that QGIS2Web doesn’t export the background OpenStreetMap layer (or I didn’t find out how to set it up). It also can’t turn off/on certain categories within a layer, it can only turn off/on the whole layer. At the same time, I found that the plugin writes pretty frantic code – 4 layers for 332 lines of code, I managed 84 lines and I’m sure it could be done more elegantly (i.e. less lines/code).
QGIS2Web examples (layers preparation, export and final map).
The second attempt was the GISQuick plugin, which also looks promising on the web, but I couldn’t get it to work at all, so I tried to “write” the whole thing myself. This brings us to the magic word Leaflet. I’ll admit without torture, I knew Leaflet was used for web maps, that’s where I ended up – so – it’s an open-source JavaScript library for creating web map applications – see Wikipedia or Leafletjs.com for more.
I’ll try to describe the process of how I created the map in a very simple way, hopefully it will help beginners like me – some of the steps took me a really long time, I’m sure it could have been done differently, easier, etc.
For this, I had a geojson “districts” that I saved as *.js and used this command to load it. I just opened the geojson in notepad and edited it – see below:
This describes how I defined the layer symbology, map center and zoom, base map selection, layer on/off panel, and scale.
I spent a few hours on this (my map has a bit more layers and symbology), but in the end I don’t think it was that difficult. Yes, it’s “just a boring map”, but it’s MINE! It’s written using open-source libraries, layers created/edited in open-source QGIS.
I’m starting to realize that maybe I should rename this series and instead of From “Hello, World!” to AR web apps, it should be called Idiot’s guide to coding, or Coding for Dummies, but both of those names are already taken 🙂 Why did I consider renaming it? Because I am a loser! I thought I had at least some basics, but that was a mistake. So I hope my fellow GISers, will still talk to me.
So here we go!
First step/question – where/what/how will I actually write the “code”? (I’m starting to find that I don’t actually know what programming language I’ll be using the most, but more on that later). From my student days (15 years ago) I remember that we just wrote the commands in notepad, then saved the file as somename.html and tried to see if (or why not) it worked. Later I had NotePad++ installed, which I thought was a cool gadget at the time. So when I was wondering what software to use for writing code, I looked up if NotePad++ still existed and wow! the latest version is from March 2021. To avoid diving headfirst into the first SW, I did some quick research and asked my colleagues. My programming Guru Ondra recommended Visual Studio Code and since I didn’t really have any preferences, Visual Studio won. The change from the classic Notepad is amazing, but I guess it’s the standard these days.
Second step – if I want to test something on mobile, or send a sample to someone, I probably need some hosting. Although I’ve been in charge of websites for various projects – GISportal, EmotionalMaps, and the Department of Development and Environmental Studies website – I’ve always been more of a WordPress administrator/user and have no experience with hosting. Anyway, I chose basic web hosting with Wedos, which will be enough for basic testing, plus I renewed a long-expired domain that I used to use – JirkaPanek.cz
Before I start writing my own apps, I need to test how such an AR interface works, how to edit individual parameters, etc. As a pretty nice introduction and at the same time amazingly elegant solution, while doing some research I came across an article by Fauzi Ali – Creating Web-Based Augmented Reality With Just 10 Lines of HTML Code (For Beginners – AR.js), in which he describes a simple use of the AR.js JavaScript library for creating augmented reality on the web. In addition to AR.js, the demo also uses A-Frame, which is an open-source web interface for creating virtual or augmented reality in a web browser environment. The third important component of AR applications is the “marker” – that is, some marker/QR code that triggers an AR visualization when you point a mobile phone camera or webcam at it. In this demo, the so-called Hiro marker is used, which is simply “a marker that triggers a certain reaction on the web”. You can have several such markers, you can create your own, etc. I’ll probably come back to this at some point, but for now Hiro will do for me.
Hiro marker
So, if you run the following code (see below), or open this codepen.io site (copy the source code there – maybe if you don’t have your own hosting), and point at the Hiro marker, you’ll see a semi-transparent cube! Wow, your/my first AR visualization!
This will load two important libraries – AR.js and A-Frame (see above).
<a-scene embedded arjs>
We insert from the A-frame library into the HTML and tell A-frame that we want to initialize AR.js with the embedded arjs in . In other words, we create a scene that we can insert other objects into – in this example, it’s a semi-transparent cube:
And finally, let’s say that if the camera sees a Hiro marker, it will display that element (cube, image, model, etc).
<a-marker-camera preset='hiro'></a-marker-camera>
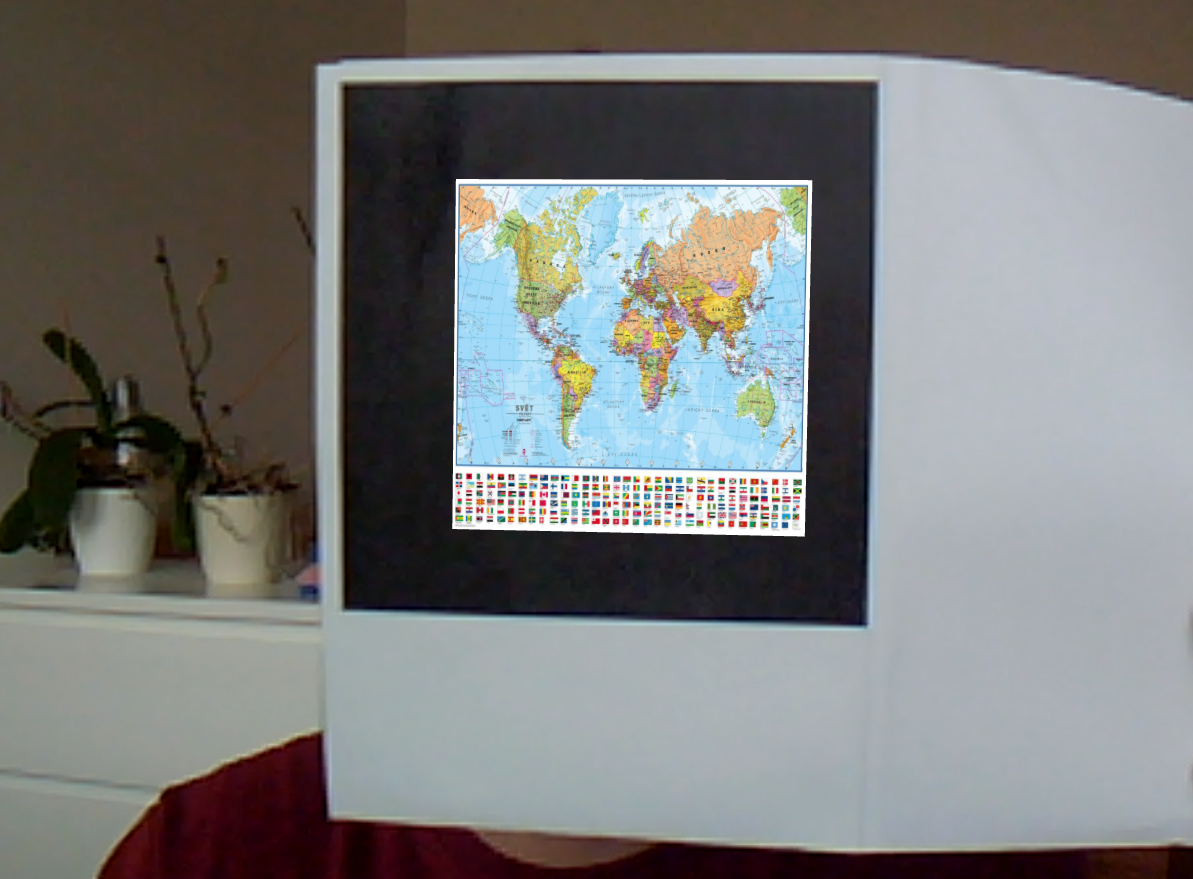
Of course, there’s a lot more you can do with it, adding animations, setting up interactions, etc., but I haven’t gotten to that yet. I did try inserting an image – see below, and learning the “rotation” parameter so that the image “looks” at me and isn’t rotated weirdly, etc.
<!doctype HTML>
<html>
<script src="https://aframe.io/releases/0.9.2/aframe.min.js"></script>
<script src="https://raw.githack.com/jeromeetienne/AR.js/2.0.5/aframe/build/aframe-ar.js"></script>
<body style='margin : 0px; overflow: hidden;'>
<a-scene embedded arjs>
<!-- create your content here. just a box for now -->
<a-image rotation="-90 0 0" src="https://i.cdn.nrholding.net/43142277/2000/2000"></a-image>
<!-- define a camera which will move according to the marker position -->
<a-marker-camera preset='hiro'></a-marker-camera>
</a-scene>
</body>
</html>
Sample map (picture on the internet) over Hiro marker
Honestly, I thought it would be harder, but I made it through the first step. Yes, it’s just a simple cube/map in space, but it’s a start!
In the first part of this series, I described my initial motivation to start learning “programming” and slightly outlined my goal – to be able to work with Augmented Reality (AR) objects through a web interface (ideally on a mobile device), ideally over a map base. Before I start describing my beginnings with writing code, I would like to explain a few more details.
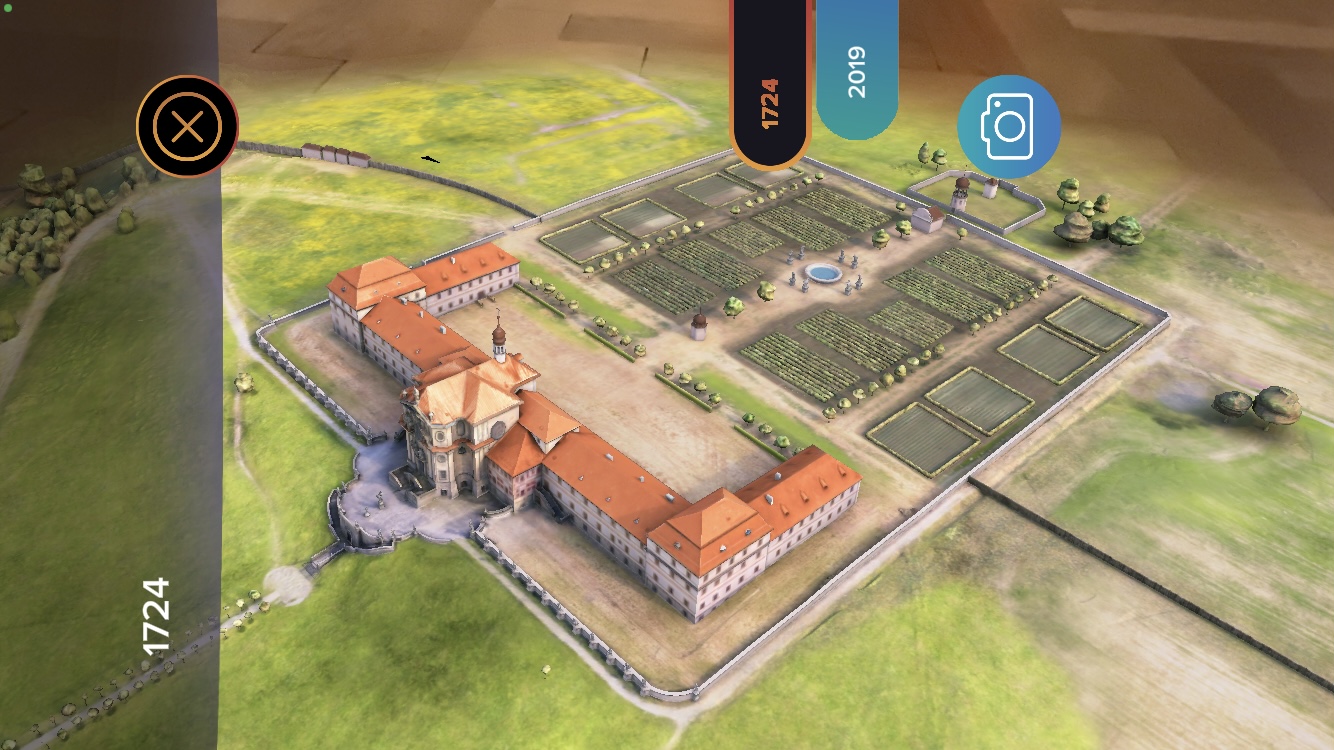
The title of this series is From “Hello, World!” to AR web apps. I showed what AR is and what web apps using AR can be in the first episode. Another interesting mobile app using AR is Visit.More, which really blew me away, but there are many interesting apps.
The Baroque castle of Kuks through the Visit.More app
So why is Hello, World! in the title? This is one of the first texts that is learnt when programming, or appears as a default message when setting up blogs, etc. It’s described quite nicely on Wikipedia, where this is mentioned, among other things. “The first known use of “hello, world” in computer literature appeared in 1972 in Kernighan’s book Tutorial Introduction to the Language B:“
main( ) {
  extrn a, b, c;
  putchar(a); putchar(b); putchar(c); putchar('!*n');
}
a 'hell';
b 'o, w';
c 'orld';
So it’s been almost fifty years from those first lines of program code to today’s AR web applications, and I’m going to try to make sense of those fifty years of development and maybe even learn some things. As part of the series, I’ll post links here to interesting resources and tutorials that I’ll be using. I’d like to start by mentioning some inspirations that also motivated me to get started.
My role models/motivations:
Online maps – my friend, classmate and colleague Rost’a Nétek, author of the book Web Cartography.
Programming guru – my friend, classmate and colleague Ondra Růžička, with whom I have been inventing and improving the PocitoveMapy.cz platform since 2014, and to whom I always send snippets of my code asking “Do you know why it doesn’t work?”. Ondra has never failed me and always knew where I made some schoolboy mistake 🙂
Promoter(s) of open source solutions – especially Jáchym Čepický, whose blog, which is no longer active, I used to devour as a student.
Honza Brus – another colleague from Olomouc from then Department of Geoinformatics, who has incredible insight and thanks to his advice and examples I actually decided to go in the direction of AR in the field of participatory planning.
“Sci-fi” use of GIS – The aforementioned MIT Media Lab and their CityScope project, which is completely open-source and available on GitHub or in their environment.
Ariel Noyman – a researcher at MIT working on connecting cities (Smart Cities) and technologies like CityScope. When I corresponded with him about my research and tried to get some advice on where/how to start creating AR models for participatory planning, I got some pretty interesting feedback. I thought it was possible to work in some existing software platforms, but his response was “There is certainly no ‘optimal’ platform, only the one optimal for your project. The reason webgl is exciting is because it is virtually platform and device agnostic. Unity is great for prototyping, but I think that as researchers we also have a small role in promoting FOSS over industry products. In both cases coding will be involved, and doing webgl will also teach you JS and GLSL, both useful for other projects.“
Especially the highlighted part (I highlighted it, not him in the email) reinforced my belief that (custom) open source is considered a sign of quality in the west, and especially in science, so all the more reason to go for it!
Even though I am a GIS graduate (my diploma says “Major in Geoinformatics”), I say everywhere that I am a geographer. Partly this makes it easier for me to explain questions like “What is geoinformatics?” and partly because I never really considered myself a “GIS guy”. To me, a GIS person is someone who can program a GIS server, or rather, when I was a student, the good ones could run Minnesota MapServer, for the younger years – it’s an opensource map server developed in the mid-90s (downloadable here). Those were the “real GIS guys” for me when I was in college. The rest of us who avoided programming are more likely to be geographers, maybe quantitative geographers, or geodata scientist, or cartographers (I’m not either), etc.
I started studying geoinformatics at Palacky University Olomouc (Czech Republic) in 2004, and although I took a few classes where we learnt different programming languages or tools – HTML, CSS, Avenue, or R, I never enjoyed it or was good at it, so I graduated without being able to write my own website, edit a Python script, or start a MySQL database. With today’s job market and GIS, it may sound crazy, but 10-15 years ago it wasn’t so sci-fi (avoid programming).
I believe my classmates will probably not forget these lines 🙂
However, I find that I’ve missed the train the last couple of years, that without programming (or at least a basic ability to customize the code), there’s not much you can do in GIS, especially if you’re trying to use primarily open-source tools like I am (I work primarily in QGIS). To make matters worse, I’ve decided that I’d like to spend the next academic year in the US, where I’ve been accepted as a Fulbright-Masaryk Fellow. So, thanks to the Fulbright Commission, I will be working for six months in Prof. Helena Mitasova’s team at the Center for Geospatial Analysis at North Carolina State University. The combination of the need for personal growth and the pressure not to look like a moron in the US resulted in my resolution to start (in my “old age”) programming.
My goal is to work with touch and virtual tools combined with GIS in the field of (participatory) urban planning. My role model, goal and motivation are projects developed both at NCSU (Tangible Landscape) and at MIT in the Media Lab team under the name CityScope (augmented reality demonstration). That’s why I decided to start such a programming “diary”/blog, which I will publish here on GeoParticipation blog – most of these texts are also available in Czech at GISportal.cz.
I think it makes more sense to write it for a community that is close to the topic than to start a new blog that maybe nobody would even read. At the same time, my suffering/effort will hopefully be a motivation for others, and a demonstration that it makes sense, and that maybe it’s not even completely impossible to start programming a few years out of college.
I would be happy if you would share your experiences, ideas, or insights ideally as comments directly on the blog here. Keep your fingers crossed, it’s going to be a struggle!