As part of a project at EmotionalMaps, a web map needed to be made for a client. Normally Ondra would have done this in no time, but this time I decided to program such a web map myself as part of my attempts to learn how to “code”.
The first idea was to make the maps/layers in QGIS and then use the QGIS2Web plugin to “just export” the web viewer. Cool idea that looked simple, unfortunately I soon found out that QGIS2Web doesn’t export the background OpenStreetMap layer (or I didn’t find out how to set it up). It also can’t turn off/on certain categories within a layer, it can only turn off/on the whole layer. At the same time, I found that the plugin writes pretty frantic code – 4 layers for 332 lines of code, I managed 84 lines and I’m sure it could be done more elegantly (i.e. less lines/code).
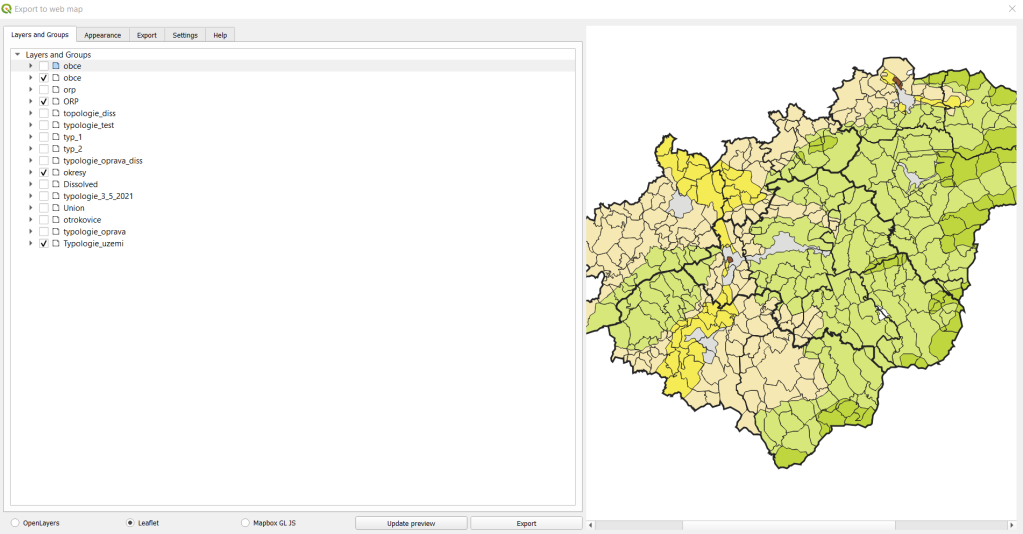
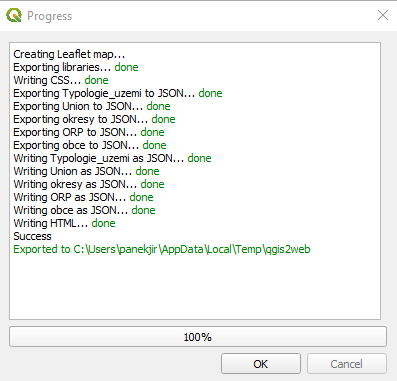

QGIS2Web examples (layers preparation, export and final map).
The second attempt was the GISQuick plugin, which also looks promising on the web, but I couldn’t get it to work at all, so I tried to “write” the whole thing myself. This brings us to the magic word Leaflet. I’ll admit without torture, I knew Leaflet was used for web maps, that’s where I ended up – so – it’s an open-source JavaScript library for creating web map applications – see Wikipedia or Leafletjs.com for more.
I’ll try to describe the process of how I created the map in a very simple way, hopefully it will help beginners like me – some of the steps took me a really long time, I’m sure it could have been done differently, easier, etc.
Preparing the page to insert the Leaflet map – I followed the Leaflet Quick Start Guide, so:
<link rel="stylesheet" href="https://unpkg.com/leaflet@1.7.1/dist/leaflet.css" integrity="sha512-xodZBNTC5n17Xt2atTPuE1HxjVMSvLVW9ocqUKLsCC5CXdbqCmblAshOMAS6/keqq/sMZMZ19scR4PsZChSR7A==" crossorigin=""/>

 https://unpkg.com/leaflet@1.7.1/dist/leaflet.js
Leaflet CSS and link to Leaflet JavaScript
http://okresy.js
For this, I had a geojson “districts” that I saved as *.js and used this command to load it. I just opened the geojson in notepad and edited it – see below:
var districts = {INSERT CONTENTS OF GeoJSON HERE}
The whole map script is then like this:
<script>
var vrstvy = L.layerGroup();
var okresyLayer = L.geoJSON(okresy, {color: "#000000", fillColor: 'grey', fillOpacity: 0, weight: 3,opacity: 1,}).addTo(vrstvy);
var mbAttr = 'Map data © <a href="https://www.openstreetmap.org/copyright">OpenStreetMap</a> contributors, ' + 'Imagery © <a href="https://www.mapbox.com/">Mapbox</a>',
mbUrl = 'https://api.mapbox.com/styles/v1/{id}/tiles/{z}/{x}/{y}?access_token=pk.eyJ1IjoibWFwYm94IiwiYSI6ImNpejY4NXVycTA2emYycXBndHRqcmZ3N3gifQ.rJcFIG214AriISLbB6B5aw';
var grayscale = L.tileLayer(mbUrl, {id: 'mapbox/light-v9', tileSize: 512, zoomOffset: -1, attribution: mbAttr}), streets = L.tileLayer(mbUrl, {id: 'mapbox/streets-v11', tileSize: 512, zoomOffset: -1, attribution: mbAttr});
var map = L.map('map', {
center: [49.2468,17.6791],
zoom: 10,
layers: [grayscale, vrstvy]
});
var baseLayers = {
"Grayscale": grayscale,
"Streets": streets
};
var overlays = {"Okresy": okresyLayer};
L.control.layers(baseLayers,overlays).addTo(map);
L.control.scale().addTo(map);
</script>
This describes how I defined the layer symbology, map center and zoom, base map selection, layer on/off panel, and scale.
I spent a few hours on this (my map has a bit more layers and symbology), but in the end I don’t think it was that difficult. Yes, it’s “just a boring map”, but it’s MINE! It’s written using open-source libraries, layers created/edited in open-source QGIS.
Sample of my version of the map
In the next installment, I’ll come back to AR and the markers you need to understand for using AR mobile apps.
Have a great day and thanks for your comments.